

Have you checked these ratios before investing?
Key Financial Ratios

Understanding a company is a key before investing. Now how does one understand a company? There are various parameters like the financial numbers achieved by the company, the growth rate, qualitative factors like corporate governance and so on and so forth. By just reading these numbers in isolation will not provide much insights. These numbers when compared with a peer company will provide guidance on the company’s performance. A more insightful understanding would be by finding out the financial ratios derived from the numerical values taken from financial statements.
Profit & Loss Account
Balance Sheet and
Cash Flow Statement
The financial ratios derived from the above financial statements can help in more informed decision on which company to invest in (along with other parameters to value a company). Ratio analysis is one part of the fundamental analysis of a company
Purpose of Financial Ratios:
Analyze Company Performance: The financial ratios over the years helps in understanding the performance of a company over time and shows a particular trend. For example: An increasing debt-equity (DE) ratio means that the company has increased leverage on its books and that may lead to increase in financial costs and repayment challenges over time.
Comparable Analysis: Financial Ratios also help in comparing the companies in a particular sector. While the sales numbers will vary for company A and B, but they can be compared on the same parameters by taking into account the financial ratios. For example: DE Ratio of Company A is 1 and Company B is 0.7, then Company B is less leveraged and hence, possibly in a better financial position than Company A.
Please note that the financial ratios should not be used in isolation. The ratios vary across sectors like the leverage will be higher in infrastructure sector v/s IT sector. Also, within a sector, one should use more than one ratio because even if one ratio is out of the framework, the other ratios might be favourable.
Users of Financial Ratios:
By internal management team to analyze and understand the company’s performance (for MIS purposes as well)
By equity research analysts, to make an investment decision of whether to invest or sell a particular company stock.
By rating agencies, to provide a rating on their long-term and short-term liabilities
By creditors (banks / financial institutions / trade creditors), to understand whether to lend the company or not
Now let us understand a few very important financial ratios:
Current Ratio: This measures the company’s ability to pay off short term liabilities with the current assets. The higher the current ratio, the better the repayment capacity / financial health of the company. {Current Ratio = Current Assets / Current Liabilities}
Leverage Ratio: They measure the company’s indebtness. Few common leverage ratios are:
Debt – Equity (DE) Ratio calculates the total debt against the shareholder’s equity. The higher the DE ratio, the higher the indebtness of the company and higher fixed interest cost on the profit and loss statement.
Interest coverage ratio shows how easily a company can pay off its interest expenses. Interest Coverage Ratio = Operating Income / Interest Expense. The higher the ratio is better.
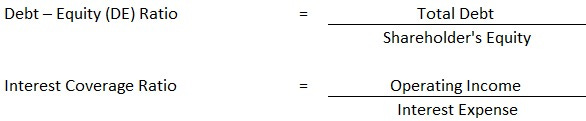
Leverage Ratios
Profitability Ratios or Return Ratios: These ratios measure company’s ability to earn profits from its sales and operations. Few common profitability ratios are:
Operating Margin Ratio = Operating Income / Net Sales. This ratio determines company’s efficiency
Return On Equity (ROE) = Net Income / Shareholder’s Equity. This ratio determines the ability to earn profits on company’s equity investments (shareholder’s equity). Higher the ROE, the better the company.
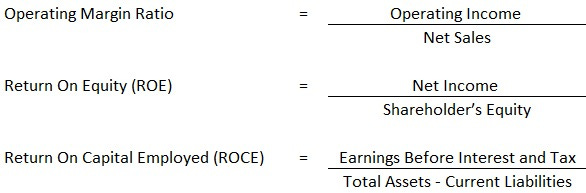
Profitability Ratios
Valuation Ratios:
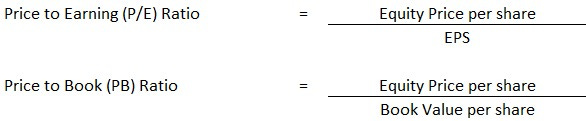
Price to Earning (P/E) Ratio:
This ratio is used to measure whether a stock is relatively undervalued or overvalued.
It is calculated as ratio of company’s share price to company’s EPS.
There are two types of PE ratios – forward PE and trailing PE ratio.
Generally, on a relative basis, higher the PE, overvalued is the company.
Many analysts use an alternative to PE ratio, which is PE to Growth Ratio to add the earnings growth element to the analysis.
Price to Book Value (PB) Ratio:
PB Ratio is the market value of the company to its book value of equity.
Book Value is total assets minus all debt / liabilities or it is the shareholders equity
PB Ratio helps to identify whether the company is overvalued or undervalued
A PB Ratio of one indicates that the stock price is trading in line with the book value of the company.

Valuation Ratios
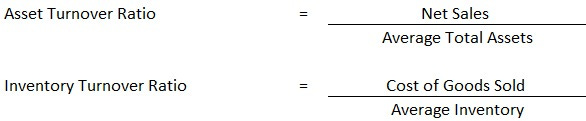
Turnover Ratios: These ratios measure how the company is utilizing its assets.
Asset Turnover Ratios: It measures the company ability to generate sales from its assets. Asset Turnover Ratio = Net Sales / Average Total Assets
Inventory Turnover Ratio: It measures how many times the company’s stocks (inventory) are sold over time. Inventory Turnover Ratio = Cost of Goods Sold / Average Inventory

Turnover Ratios


The above-mentioned ratios are few ratios which one should understand before investing. Such analysis can lead to well informed financial decision and will help in creating long term wealth accumulation. Lastly, never analyze a company with only one ratio. Combine it with other ratios to get a complete picture about the company. Happy Investing! :-)
Hit the button below and share the article with your friends and family!
Please do drop in your comments on the article in the link below:
And lastly, do subscribe to FinFacts to receive the newsletter directly in your inbox! :-)
Well cover d buddy
Super article bro